
The binomial distribution is used when there are n (a fixed number) independent trials with two possible outcomes (“success” and “failure”) with a probability that is constant.
With 10 tosses of a fair coin, what is the probability of getting 7 heads? \[Prob = dbinom(7,10,0.5) = 0.1171875\]
And what is the probability of getting exactly 5 heads? 50% you said? Not so fast: \[Prob = dbinom(5,10,0.5) = 0.2460938\]
df <- data.frame(howManyHeads=0:10)
df <- within(df, probability <- dbinom(howManyHeads, 10, .5))
ggplot(df) + geom_segment(aes(x=howManyHeads, xend=howManyHeads, y=0, yend=probability) , color="steelblue", size=2) + labs (y = "Probability", title="") + scale_x_continuous(limits= c(0,10), breaks= seq(0,10,1)) 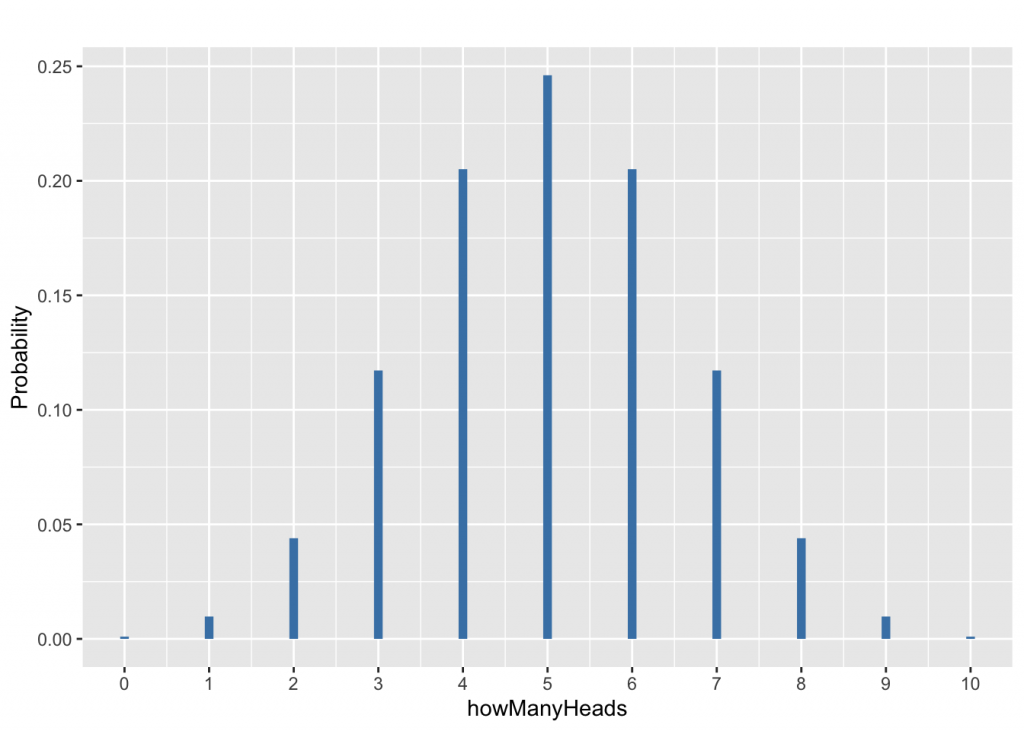
In the graph above, dbinom(4,10,0.5) = 0.2050781, dbinom(3,10,0.5) = 0.1171875, dbinom(2,10,0.5) = 0.0439453, dbinom(1,10,0.5) = 0.0097656, dbinom(0,10,0.5) = 9.76562510^{-4}.
Other problems
80% of people who purchase pet insurance are women. If 9 pet insurance owners are randomly selected, find the probability that exactly 6 are women = dbinom(6, 9, .8) = 0.1761608
60% of people who purchase sports cars are men. If 10 sports car owners are randomly selected, find the probability that exactly 7 are men = dbinom(7, 10, .6) = 0.2149908
(Credit)