
This is a very important function (family) in a vector-type language like R. Its members are apply, lapply, sapply, mapply, and tapply. I use lapply and sapply most often, although for a matrix, apply is more suitable. These functions work well for complicated iterative calculations and are MUCH faster than loops, that appear in comparison, as brute-force methods.
Set up a toy dataset
n <- 100
age <- rnorm (n, 50, 10)
b <- sample(1:3*n, n, replace=T)
c <- age * rbeta(n, 1, 5)
d <- (age/8)^3 *c + log(b) * rbeta(n, 2, 4)
e <- as.factor(sample(c("never", "former", "current"), n, replace=T, prob=c(.5, .3, .2))) # as in smoking status
f <- as.logical(sample(c("TRUE", "FALSE"), n, replace=T, prob = c(0.2, 0.8)))
df <- data.frame(a = age, b=b, c=c, d=d, e=e, f=f)
head(df) #summary(df)
## a b c d e f
## 1 52.93529 200 1.665629 485.3124 never FALSE
## 2 47.85212 200 1.532457 329.6634 former FALSE\(apply\)
Applies a function on a matrix, across dimension, i.e. by lines or by columns (referred to as margins, 1 = row by row, 2 = by columns).
It is easy to check the data type of columns in a data frame:
sapply(sapply (df, is), function(x) x[1])## a b c d e f
## "numeric" "numeric" "numeric" "numeric" "factor" "logical"The following do NOT work, even though recommended
apply(df, 2, class) ## a b c d e f
## "character" "character" "character" "character" "character" "character"apply (df, 2, function (x) sapply (c("character", "complex", "integer", "logical", "numeric"), function(y) class(x) %in% y))## a b c d e f
## character TRUE TRUE TRUE TRUE TRUE TRUE
## complex FALSE FALSE FALSE FALSE FALSE FALSE
## integer FALSE FALSE FALSE FALSE FALSE FALSE
## logical FALSE FALSE FALSE FALSE FALSE FALSE
## numeric FALSE FALSE FALSE FALSE FALSE FALSEapply (df, 2, function(x) get(typeof(x)))## $a
## function (length = 0L)
## .Internal(vector("character", length))
## <bytecode: 0x7fa3d88b6e50>
## <environment: namespace:base>
##
(trimmed for brevity)There are many other uses for $apply$, such as selecting a subset of the data frame with df[ ,sapply(df, is.X)]
apply(df[,sapply(df,is.numeric)], 2, sd) # by column; does NOT make sense to go by row.## a b c d
## 10.509733 81.550629 7.387919 4154.847557norm <- apply(df[,sapply(df,is.numeric)], 2, shapiro.test); #str(norm)
sapply(norm, function(x) (names(x)))## a b c d
## [1,] "statistic" "statistic" "statistic" "statistic"
## [2,] "p.value" "p.value" "p.value" "p.value"
## [3,] "method" "method" "method" "method"
## [4,] "data.name" "data.name" "data.name" "data.name"sapply(norm, function(x) format(x$p.value, nsmall=2))## a b c d
## "0.2955282" "1.631008e-10" "3.465593e-10" "2.371274e-16"sapply(norm, function(x) format(x$statistic, nsmall=5))## a.W b.W c.W d.W
## "0.9845689" "0.7940378" "0.8047188" "0.5296003"apply(df[,sapply(df,is.numeric)], 2, summary) ## a b c d
## Min. 25.63873 100 0.059253 10.05707
## 1st Qu. 42.79097 100 3.089976 656.19388
## Median 49.23844 200 7.013626 1480.94939
## Mean 50.54818 196 8.282124 2662.39926
## 3rd Qu. 58.66898 300 10.869602 3178.33952
## Max. 82.39060 300 50.694784 27690.42794Retrieve \(median (IQR)\)
apply(apply(df[ ,sapply(df,is.numeric)], 2, summary), 2, function (x) c(x[3],x[2],x[5]))## a b c d
## Median 49.23844 200 7.013626 1480.9494
## 1st Qu. 42.79097 100 3.089976 656.1939
## 3rd Qu. 58.66898 300 10.869602 3178.3395You can add an argument to the function
par(mfrow = c(2, 2))
t <- apply(df[ ,sapply(df,is.numeric)], 2, qqnorm, plot.it=T)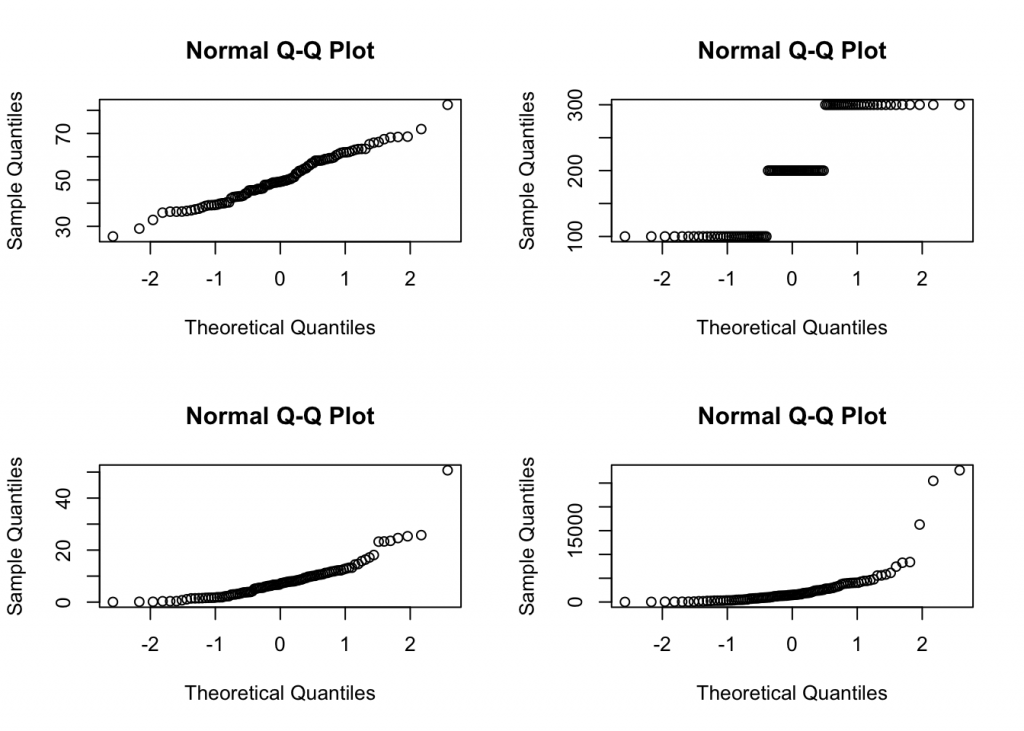
par(mfrow = c(1, 1))Can be used to add random NAs to a data frame:
fractionBlank <- 10
df <- apply (df, 2, function(x) {x[sample(1:n, floor(n/fractionBlank), replace=T)] <- NA; x} )
df <- data.frame(df)
And count the number of NAs per column with a nested structure
apply(apply (df, 2, is.na), 2, sum)## a b c d e f
## 10 10 10 9 10 9\(lapply\) and \(sapply\)
For a matrix you have to use \(apply\), but for a data frame, can use \(lapply\) (returns a list) or \(sapply\) (simplified lapply, returns a vector). A classic example is loading libraries
sapply(c("ggplot2", "reshape2"), require, character.only = T)## Loading required package: ggplot2
## Loading required package: reshape2
## ggplot2 reshape2
## TRUE TRUEAs already shown above, it is possible to nest multiple levels of \(sapply\) to use with functions with two (or more) arguments. For example can create a matrix with 10,000 elements blazingly fast:
set.seed(53)
n <- 10
sample <- rnorm (n, 32, 12)
mu <- seq (20, 60, length.out=100);
sd <- seq (9, 16, length.out=100);
loglik <- function(mu, sd) (sum(log(dnorm(sample, mu, sd))))
Below is the nested application of sapply
m <-  sapply(mu,  function(x) sapply(sd, function(y) loglik(x,y)))
dimnames(m) <- list(sd, mu) #str(m)
The above is a real example of MLE, and the brute force version (using loops) takes a considerable amount of time.
mx <- which (m == max(m), arr.ind = T); max(m); mx## [1] -39.2222
## row col
## 12.2525252525253 47 31mu[mx[2]] #mle for mu## [1] 32.12121sd[mx[1]] #mle for sd## [1] 12.25253lapply can be used to convert a table of explanatory variables into a data frame (more to come on this subject). (Crawley p250)
With sapply, any arg beyond the second will be passed to the function. This example is useful if you have many variables and want to find their correlation:
#cors <- sapply(df, cor, y=b); cors # call the function cor for every column. \(mapply\)
This version applies to non-vectorized functions, that accept multiple arguments. Although many R functions are vectorized, some are not, including user generated functions. You can use MoreArgs = list(arg1=sd)
\(tapply\)
It is very helpful to vectorize functions. Its syntax is \(tapply (x, INDEX, FUN, …)\) where INDEX is a grouping factor that is coerced to a factor (if not already one). You can do counts (using the function length), means, etc across datasets by factors with exceptionally efficient code (see Section 6.4 in Introduction to Scientific Programming and Simulation Using R. Very neat!
\(by\)
This function is closely related to \(tapply\) in that \(by\) allows one to apply a function to a group of rows by selecting a grouping factor. The syntax is \(by(dataframe, groupingfactor, function)\). See Section 6.6 in The R Cookbook.
The advantage of \(by\) over \(tapply\) is that it returns a special list that has a print method, but accessing individual elements is less convenient (section 8.2 of Data Manipulation with R).