
A sports team scores 84 points in 21 games, so the average score is 4 points per game. What is the probability that it scores 1 point per game? Or 6 points, or more than than 4? The answer is in the Poisson distribution, where variance = mean, denoted as $\lambda$.
require(ggplot2, quietly = T)
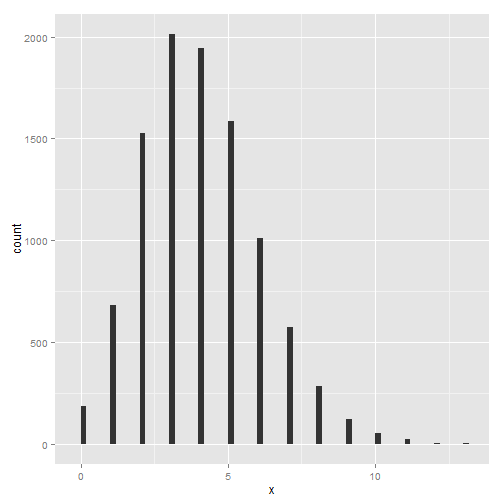
pd <- data.frame(x=rpois(10000, 4)) # generate random deviates
head(pd)
##   x
## 1 2
## 2 5
## 3 9
## 4 2
## 5 6
## 6 3
breaks <- pretty(range(pd$x), n = nclass.FD(pd$x), min.n = 1)  # pretty binning
bwidth <- breaks[2] - breaks[1]
ggplot(pd, aes(x = x)) + geom_histogram(binwidth = bwidth) # geom_density(adjust=2)
ppois(1, 4)  #distribution function (cumulative)
## [1] 0.09158
ppois(6, 4)
>## [1] 0.8893
ppois(10, 4)
## [1] 0.9972
dpois(1, 4)  #density (aka probability)
## [1] 0.07326
dpois(4, 4)
## [1] 0.1953668
dpois(6, 4)
## [1] 0.1042
dpois(10, 4)
## [1] 0.005292
qpois(0.025, 4)  #quantile function
## [1] 1
qpois(0.5, 4)
## [1] 4
qpois(0.975, 4)
## [1] 8
The answer to the question “What is the probability they will score more than 3 points?” lies in its reciprocal, namely the probability they will score 3 or fewer:
1 - (dpois(0, 4) + dpois(1, 4) + dpois(2, 4) + dpois(3, 4))
## [1] 0.5665
What is the probability they will score more than 4 points?
1 - (dpois(0, 4) + dpois(1, 4) + dpois(2, 4) + dpois(3, 4) + dpois(4, 4))
## [1] 0.3712