The hypergeometric distribution is used to solve the classic “balls in an urn” proble. Suppose one has 7 red balls and 3 white ball in an urn, and draws 2 balls. What is the probability that both balls are white?
i=3 # white balls
j=7 # red balls
n=2 # no. of balls drawn
ph <- dhyper(0:n, i, j, n); ph
## [1] 0.46666667 0.46666667 0.06666667barplot(ph, names=(0:n), col="red", xlab="outcome", ylab="probability")Let’s make a function to allow quick replication
hyperg <- function (i, j, n) {
  ph <- dhyper(0:n, i, j, n)
  print(ph)
  barplot(ph, names=(0:n), col="red", xlab="outcome", ylab="probability")
}
Other combinations
hyperg(3,7,3) #same problem, but drawing three balls## [1] 0.291666667 0.525000000 0.175000000 0.008333333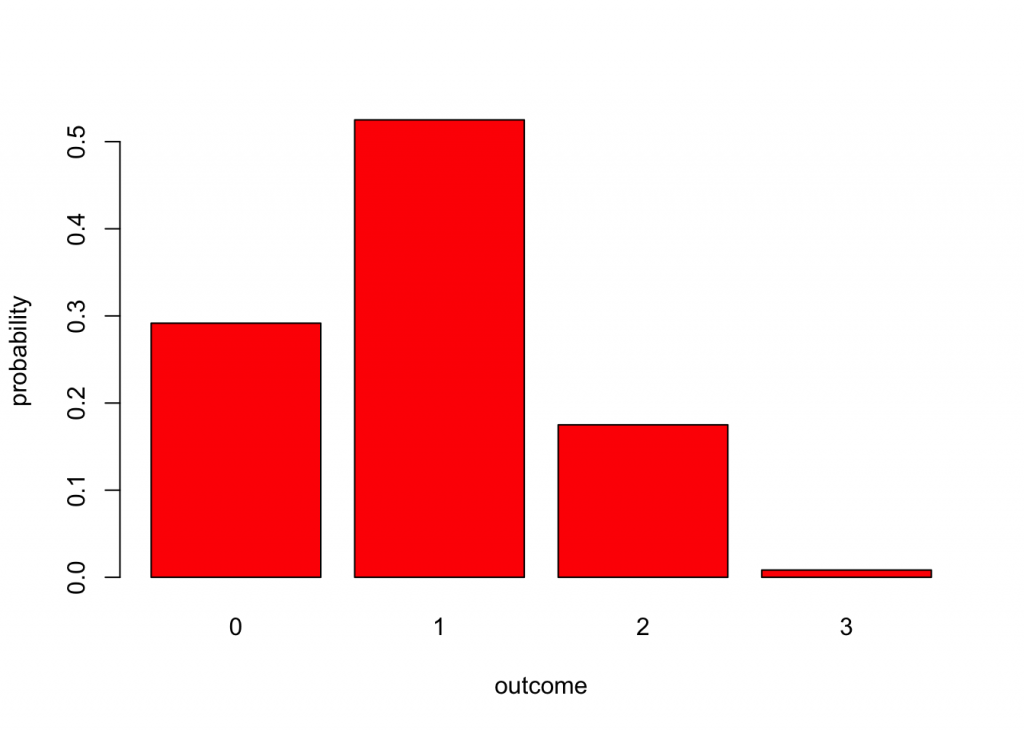
hyperg(2,8,2) #two and eight, draw 2## [1] 0.62222222 0.35555556 0.02222222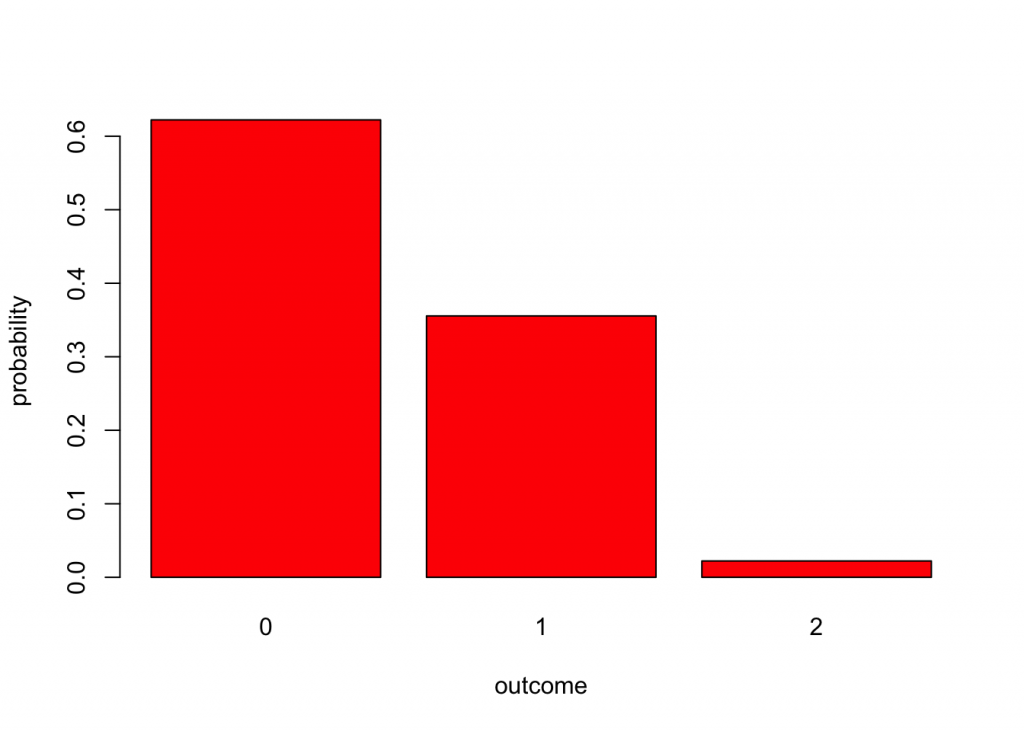
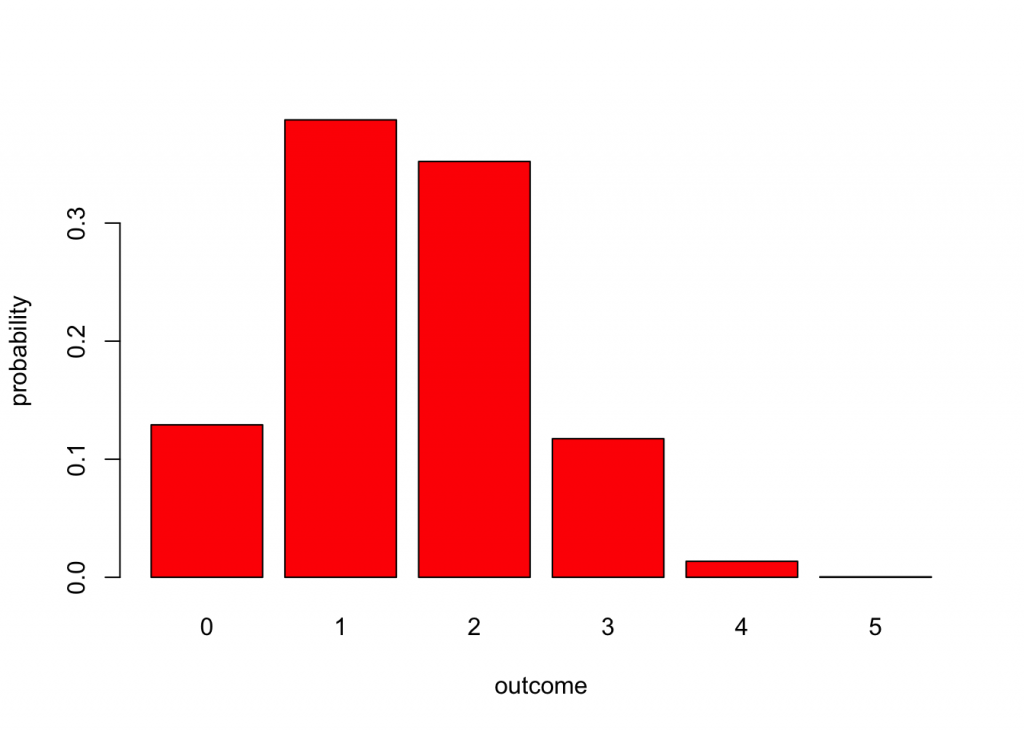
hyperg(6,14,5) # 6, 14, draw 5## [1] 0.1291279670 0.3873839009 0.3521671827 0.1173890609 0.0135448916
## [6] 0.0003869969